Tuesday, December 21, 2010

KLSE: CIMB (Buy signal confirmed)


Bullish hammer formed on 21/12/10, and we can see the shadow line touched the 20MA and the trend line I've drawn. The next day, 22/12 it closed above the hammer. This gave us a confirmation for this bullish reversal.

Then, by lookign at the indicators, MACD pointing up and soon MACD will form a green histogram if it form another white candle today.

BULL.

KLSE: UEMLAND (Bullish signal confirmed)


A bullish reversal signal formed on 21/12/10 - hammer. And a confirmation made on 22/12/10 with break out flag + high volume.

And I found this potential form of bottomed head and shoulder. Once it broke out its neckline with high volume. $$$$$$$ coming.

Besides, the MACD histogram turned into green colour from more than 4 red histogram. This shows another reversal from bear to bull.

Lastly, we also can see the stochastic is pointing up.

BULL.

Sunday, November 21, 2010

Stocks to watch from TA views:-

TA - Well supported by 20 MA. Classical support (Previous resistance) 0.755. Volume shown sloping down and decreased drastically. (Just profit taking). Either wait for high volume with a bullish reversal signal, or MACD turns into green.

Tebrau - Doji appeared on 18/11/10 and another bullish reversal signal came out on 19/11/10 with higher volume. Just wait for MACD histogram to turn in green or any breakout on the 50/20 MA for a more safety trading. Currently well supported by classical support (the previous lower low). Stochastic in oversold region and is about to form bullish crossover.

KFima- well supported by previous high, 1.33. Rebounded from 20MA. Stochastic is about to form bullish crossover as well. If the FBMKLCI could perform well on next week, most likely will boost all the abovementioned stocks.

E&O - Ascending triangle formed. (Higher low, but same high) Await for breakout on 1.26 or for aggressive players could choose to enter now since its rebounding but the risk reward ratio is not really good.

IJM - wait for breakout as well to break the resistance at 5.70.

Harta - forming Bollinger band squeeze. If it could break above 5.63 would be a good entry.


Ramunia - this is one of the rumours from my uncle's friend. This guy said he has insider news saying that this company is about to announce that they are going to released from the PN7 on December. Believe it or not up to you.


The sectors which look positive are Finance and property.

RHB, Affin, AFG, AMMB are top picks for finance sector

Sunway (wait for breakout), UEMland, IJM, E&O and Tebrau are top picks for property sector

Saturday, November 6, 2010

KLSE: LionDiv (Buy signal confirmed)

Buy signal confirmed on 4/11/10 with high volume. Harami pattern formed on 3/11/10 and white long candle as the confirmation on 4/11/10. MACD green bar formed with smaller size. Stochastic also crossing over.

KLSE: Annjoo (Awaiting for buy confirmation)

Steel sector has been moving strongly recently. Annjoo just break-out from the triangle. And well supported by the middle bollinger band. As we can see, the MACD green bar appeared with smaller bar which is a sign of reversal. Now, wait for confirmation and high volume.

Wednesday, October 27, 2010

Entering correction period for a few days


A very tradisional bearish head and shoulder formation had formed today closed with a long black candle. This will lead to the next support level 3090.

Tuesday, October 12, 2010

Price of rice and sugar are rising. SGX: Wilmar, IndoFood, GoldAgri & Olam

Price of rice has made a 18 months high and sugar price are rising as well. Therefore, highly recommend stocks like Wilmar, IndoFood, GoldAgri and Olam in SGX.

Wednesday, October 6, 2010

KLSE: Landmark (1643) (Update: Bottom Head&Shoulders)


A formation of " bottom head & shoulders " formed today which is a bullish signal. However, a potential evening shooting star formed at the same time. This might lead to a reversal for this stock. On the other hand, any break above the key resistance around 1.44 or 1.45 is a confirmation of the bullish trend for this stock. Just be cautious.

SGX: BakerTech (Break-out down trend line)


BakerTech has been gone for sideway for more than 3 months. Today, it break above the trend line again with some higher volume. However, it might face the strong resistance on 0.455.

Tuesday, October 5, 2010

SGX: SunVic (Break-out down trend line)

From the chart, we can see any break-out of the trend line will lead to a high rising for this stock. Furthermore, the stochastic is showing has triggered buying signals whenever there is a break above.

As SunVic is a chemical company which supply chemicals that for textiles, coating and also productions of painting. And their main customers are from China. Therefore, high demand in China will lead to high profit for this company. As we know, China is having some measure to prevent housing bubbles and this may lead to lower demand of housing and indirectly might affect SunVic company demand products.

However, on the other hand, SunVic announced for 800%++ growth in net profits and a buy call from Philip Securities.

Thursday, September 30, 2010

Leave and watch

China market is going to off for 5 market days and US is going to announce GDP tonight. Correction might happen during these few days.

Monday, September 27, 2010

SGX: KepLand (Good buying opportunity but not much return)

Last Friday, a bullish hammer with higher volume formed and broke above the downtrend line

(correction). Today, another 5 cents rosed. The blue line in stochastic crossed up the red line. As

same as in MACD, the blue line is crossing up again to the red line.

SGX: CDL HTrust (Break above bullish flag)


This stock didn't allow this stock to break below the 20 days MA line. Today, it rebounds again and break above the bullish flag at the same time with slightly higher volume. The blue line in stochastic also crossing up the red line.

SGX: Ezions Holdings (Morning Star formed with Utmost Volume)


From the view of technical analysis, morning star has successfully formed on today with the

higher open with a white candle stick. Furthermore, the stock records the highest volume after 9

months. Then, we can see it jump climbed above the 200 MA line and just rebounds from the up

trend line. At the same time, it just broke above the recent resistance, 0.705. It closed at 0.71

today which is the key resistance. Any break above of this resistance would be a good

significance. Then, the next resistance would be 0.74

Next, from fundamental view, please refer this. 70m contract earned, and eyes on 50+% earning growth.

http://theedgesingapore.com/component/content/20860.html?task=view

Tuesday, September 21, 2010

SGX: IndoAgri (Update - Potential Evening Star, Cautious)


Harami formed and potential to be evening star. Although volume decreased, but today it still looks positive as just broke the downtrend line and the blue line of stochastic crossed up.

Did you follow ? (KNM, Landmrk and Kencana)

High rosing with high volume. Entering Overbought zone for RSI and Stochastic. Awaiting for breakout the key resistance 1.66. There might one or two corrections around here but its normal.


Its good to see it breaks another resistance with high volume. The following resistances are 1.39, 1.41 then key resistance 1.44/1.45. Obviously its entering overbought zone as well for RSI and STochastic but overall is still positive.

Well, it seems like KNM is moving up a little bit slow. Anyway, be patient. Still remain buy call in short term.

Broke below the support trend line and also the previous black candle stick. It shows a bearish and negative but buy are recommended for rebound for medium term players.

Monday, September 20, 2010

SGX: IndoAgri (Buy call)


Firstly, based on technical analysis. The chart shown a bullish signal to us. Why do I say so? Firstly, we can see it rebounds from the important support line (200 MA). Then a morning star formed today. Another white candle stick formed with high volume. Blue line in stochastic is crossing up as well.

Then fundamental analysis, DBS maintained their rating " buy " for this stock last Friday.

How much have you earned? (KNM, Landmrk)


Although the volume has slightly decreased today but this is very normal. The blue line in MACD just crossed up and this seems positive for more upper moving. Although inverted hammer formed today, but overall still remain bullish. However, please be cautious on taking profit of some shareholders.
Seems like buyers and sellers are performing strongly today and ended up with 2 cents fall with medium black candle stick. Perhaps this is just a correction.Too bad for Unisem to break below a few supports. Wait for rebound now.The downtrend line is now becoming the support line of this stock. Awaiting for rebound now. In case, another formation of black candle stick and fall more than 3% of a total of three days black would be a selling signal of this stock.Still remain bullish. However, recent slumping of petroleum price might bring some side impact to this stock.
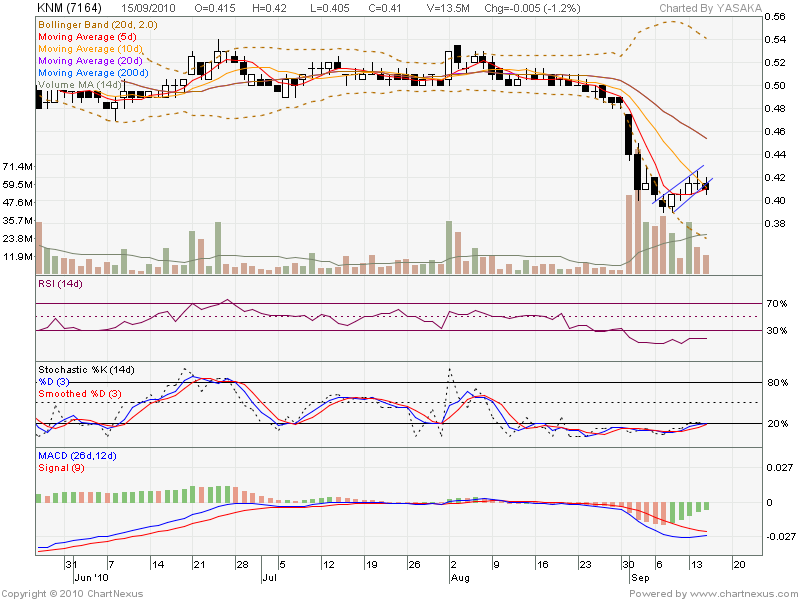
Wednesday, September 15, 2010

Index closed red as well as Landmrk, Unisem, Topglov, KNM & Kencana


Due to taking profit day, FBMKLIC closed lower in red ended the winning streak and also dragged most of the stocks closed in red as well. KNM, broke below the up trend line which is the bearish flag. Perhaps it is only a mini correction. Stop loss point at 0.39.

Topglov closed lower as well in mini white candle. Still well supported by 200 MA line and the previous downtrend line.
Black hammer formed with a long leg and decreased volume. Still bullish but cautious because might continue dragged by the index.
Inverted black hammer formed. Still bullish although decrease in volume.
Still being blocked by the downtrend line, lower volume.

Tuesday, September 14, 2010

KLSE: Unisem (5005) (Update: Further watch needed)


It seems like the price is being blocked by the downtrend line. Soon, the price will break out the

triangle. Perhaps it will rose up straight after breaking out this formation. Beware.

KLSE: Kencana (5122) (Update: Buy)

Again, broke above the bullish flag without closing below of the previous opening price. Although

a black inverted hammer formed today, but it still remain bullish due to high volume and

crossing up of blue line in Stochastic.

KLSE: KNM (7164) (Update: Identical candle sticks formed)


From the chart, identical or repeating candle sticks formed. So guess what tomorrow? Most

probably rising ? No one knows. For me, I will still buy in some of the shares.

KLSE: Topglov (7113) (Update: Volume decreased)


Another 4 cents rose, blue line in MACD is crossing up. Strong support line of 200 MA line. Next resistance will be somewhere 6.2.

KLSE: Landmark (1643) (Update: Buy signal confirmed)

The breakout is the starting point of the bullish. As we can see, there is no any line left top or

below of the white candle stick. This means it shows a very strong buyer volume which from the

opening price to the closing price. Besides, high volume shown and crossing up of blue line in

MACD to the red line. The next resistance will be 1.36 then 1.40.

Monday, September 13, 2010

Cautious on any retracement due to overbought condition

From my experience, normally there will be some correction when a stock or the index rises for the highest points or percentage in a day. Therefore, please be very cautious for this moment. Please try to avoid bad fundamental stock and low volume stocks.

KLSE: Landmark (1643) (Confirmation on Tomorrow)


This stock broke above the down trend line on 02/09/2010 and move sideway for the following

market days. A bullish long leg hammer formed today (13/09/10) with an increase of

volume
after testing below of the 200 Moving Average this morning. A close higher or break

above the triangle will be a buy signal for tomorrow and vice versa.

KLSE: KNM (7164) (Buy call recommended)


Okay, nothing much to explain on this stock. But from three of the indicators I've used (MACD,

Stochastic, RSI), they shown oversold condition and actually are showing a reversal of the

price
.
In addition, the first white hammer, then doji and inverted white hammer with the high

volume
actually giving a buying signal to us for this stock as well. The price is not

guaranteed to be rose in the next day but I always believe in my own analysis.

KLSE: Topglov (7113)


The reversal can be seen on 09/09/2010. Today (13/09/2010), the stock shot up for 32

cents
with a super high volume and break above the downtrend line. Besides, the candle also

rebounds back to the 200 Moving Average line above. The blue line in MACD indicator also

crossing up the red line. With all these, it shows a good sign and buy in signal. However,

TA research warned
that this stock might have a little poor fundamental result for 3Q. They l

lowered their target price from 7.50 to 6.50. So for those who buy this stock should be very

careful and cautious on its volatile moving
. Sorry for not giving the link of the research report

because it could only be read by clients of TA berhad.

KLSE: Kencana (5122) (Buy)

The break above of the bullish flag shape with the increase of volume is giving a

buy signal. The blue line in stochastic indicator is crossing up the red line which

is also a buy signal. RSI also in a medium level. Confirmation can be made on

tomorrow.

KLSE: AirAsia (5099) (Update)


As I've mentioned last week, the break above of the downtrend line is a buying signal. However,

the price shot up for 12 cents in a day and caused a long white candle stick has formed and

touches the Bollinger band
. This will most probably lead to a taking

profit decision on tomorrow and correction for 3 days
. Therefore, I am here to

recommend watch and see for this stock for short term player (3 days) but buy call for

medium term player
( 1-2weeks) as it just broke above the previous mount resistance.

KLSE: Unisem (5005) (Update)


As I mentioned last week, the white candle on 09/09/10 might just a correction. The stock once

broke above the triangle or the down trend line this morning
however retraced back

due to the taking profit of the shareholders
. Upon now, we still have to watch for the break

above of the triangle and the crucial support line 1.87
.

Saturday, September 11, 2010

KLSE: Unisem (5005) (Potential Break Above)


As we can see from the chart, after the break below of the up trend line, the price of the stock slumps for 36 cents. The price rebounded when it reach the previous strong support line 1.88 for 30 cents to 2.18. However, the stock couldn't stand for the high profit taking volume and retraced back to 1.88 and formed a down trend line. On 08/09/2010, the price touched the strong support line again 1.88 and rebounded in the following day for 6 cents with a medium volume. This could be just a minor correction of the down trend or the starting point of the reversal. Therefore, the confirmation can only be made by forming another white candle with higher volume or the break above of the triangle on tomorrow (13/09/2010).

KLSE: AirAsia (5099)


From the chart above, we can see three times of rebound on the 20 Days Moving Average line and also the moving up trend line. Any rebound from the trend line, break-out the bullish flag or rebound from the 20 days moving average line is the buying opportunity.

Other than that, from the fundamental analysis, ECM libra maintain buy call on AirAsia with the target price of Rm2.32.
  • Strong 2Q10 results for Group and associates
  • Expect stronger 2H10
  • Valuations are undemanding
  • Maintain Buy
The below link is the report of ECM libra on AirAsia.

http://www.ecmmoney.com/wp-content/uploads/downloads/2010/09/AIRA_100907_Flying-to-greater-heights.pdf

HKSE: China Mengniu Diary (02319)


From the chart above, a bottom head and shoulders formation formed from 03/05/2010 to 14/06/2010. A break above the resistance of the formation which is 23.80 with the high volume made a confirmation of the bullish signal of the stock. From 17/06/2010 to 16/07/2010, a top double mount formation had formed. A break below on 29/07/2010 with a very high volume gave us a very bad bearish signal. On 03/08/2010, a black hammer with a test above of the resistance (24.60). Indeed, another break below of the support line of 23.80 with an increase of volume made a confirmation of bearish signal. However, from 10/08/2010 to 09/09/2010, another bottom head and shoulders formation had formed and a break above of long white candle with high volume on 10/09/2010 gave a mini bullish signal. However, the confirmation can only be made when the break above of the 200 Moving Average line and the previous double mount resistance (24.60). Upon now, watch on 13/09/2010.

Friday, September 10, 2010

HKSE: Shougang Concord Grand Group 00730


As we can see from the chart above, double mount have formed from 27/05/2010 to 02/07/2010. A break below 0.51 as the support line gave a bearish signal to us. However, a bottom head and shoulders formation had formed from 05/07/2010 to 28/07/2010 and a break above on 29/07/2010 gave us a bullish signal. At the same time, a top head and shoulders formations had formed from 29/07/2010 to 24/08/2010. Again, another break below the support line of 0.52 of the head and shoulders formation gave us a bearish signal. On 25/08/2010, a potential morning star had formed but the confirmation of bearish has been made on 26/08/2010 which break below the main & important support line of the previous double mount I've stated above. From 25/08/2010 to 07/09/2010, a bowl shape has been formed but it retrace when it reach the previous support line which is the current resistance (0.52). This formation is potential to be another Bottom Head and Shoulder. Therefore, any rebound from 0.475 or 0.465 is a very good buying opportunity towards 0.58 (The highest price of the previous Top Head)